Make interactive data visualisation charts without back-ends.
Transform your data into interactive SVG images, animated GIFs and still PNGs that you can easily insert on your websites, presentations and social media.
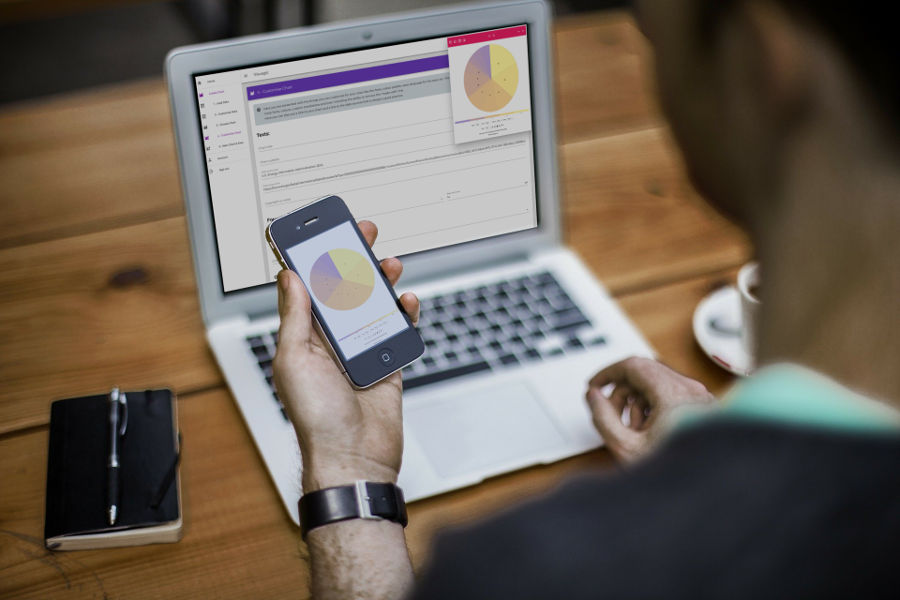
The final result is a self-contained interactive SVG image. That should make it pretty easy to embed it into your current website and let your users play with the data visualisation. During the creation process your data never leaves your hands. Then you host the visualisation on your own servers so there are no dependencies, speed or availability problems caused by our systems.
INTERACTIVE CHARTS
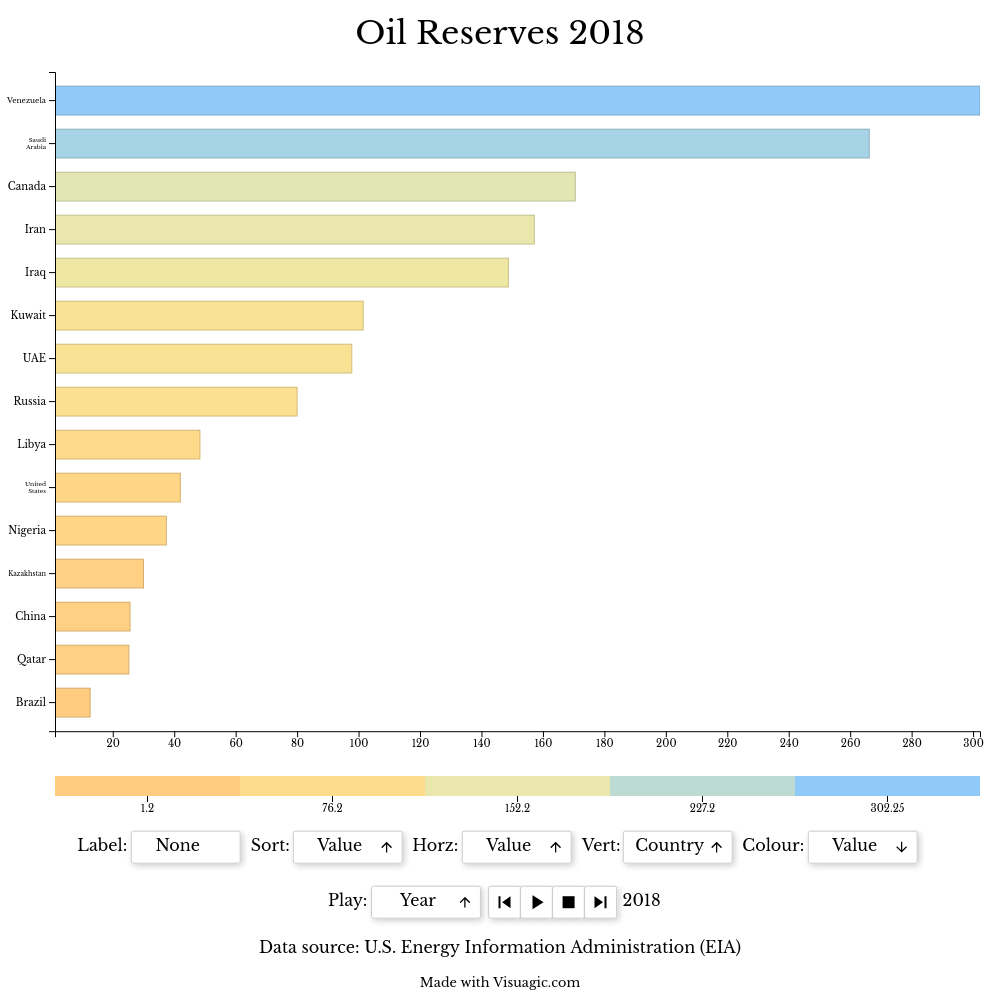
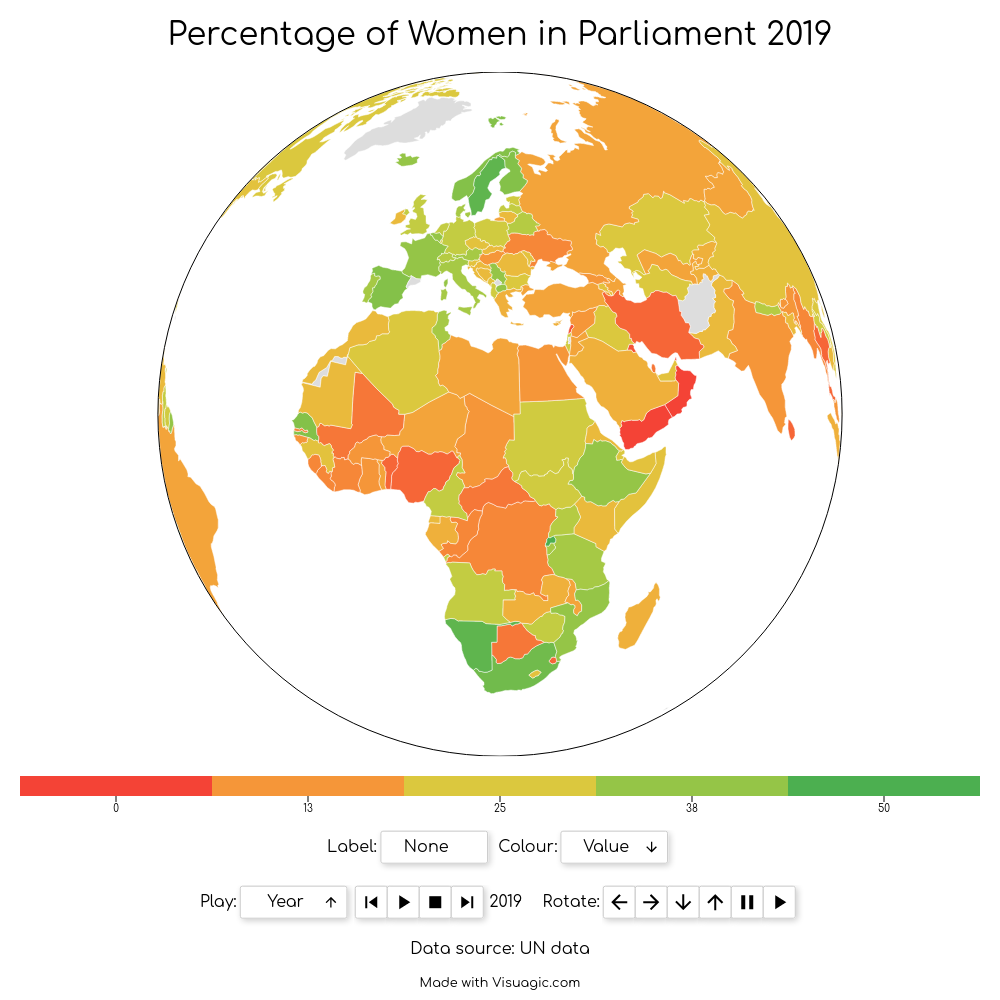
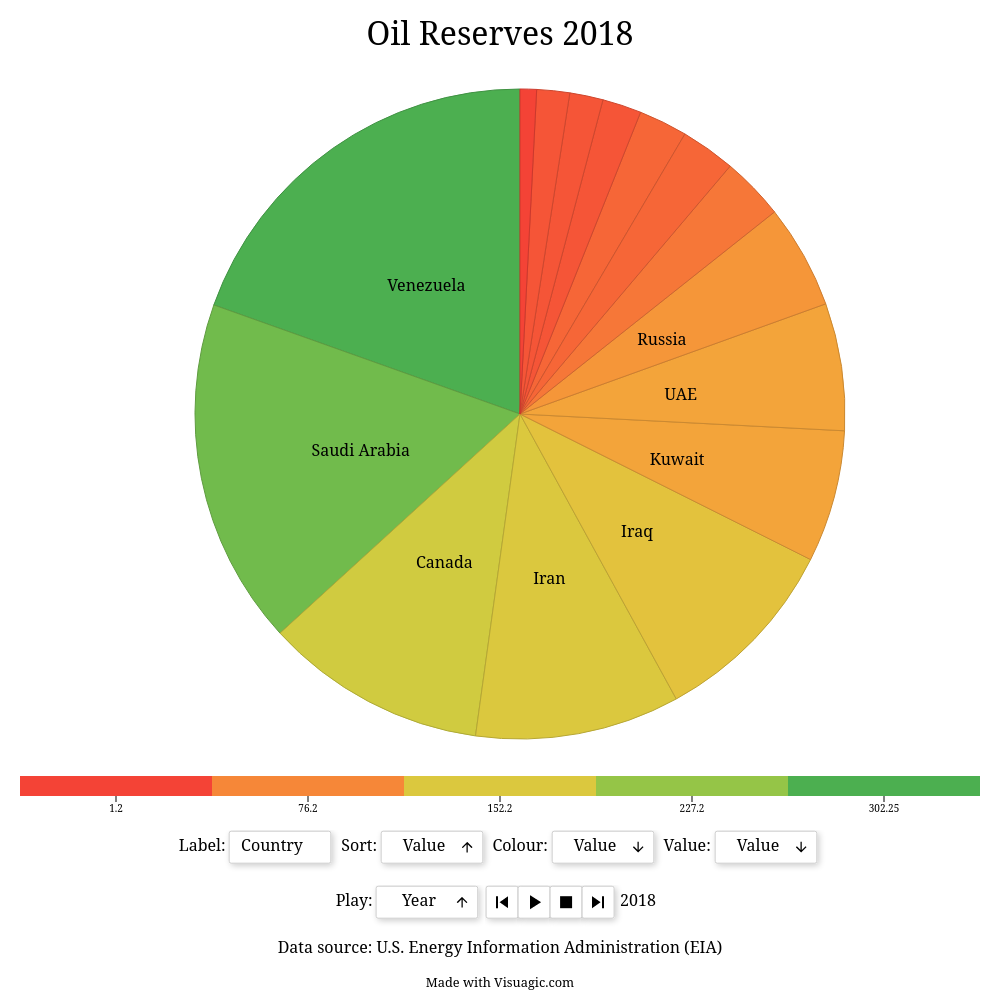
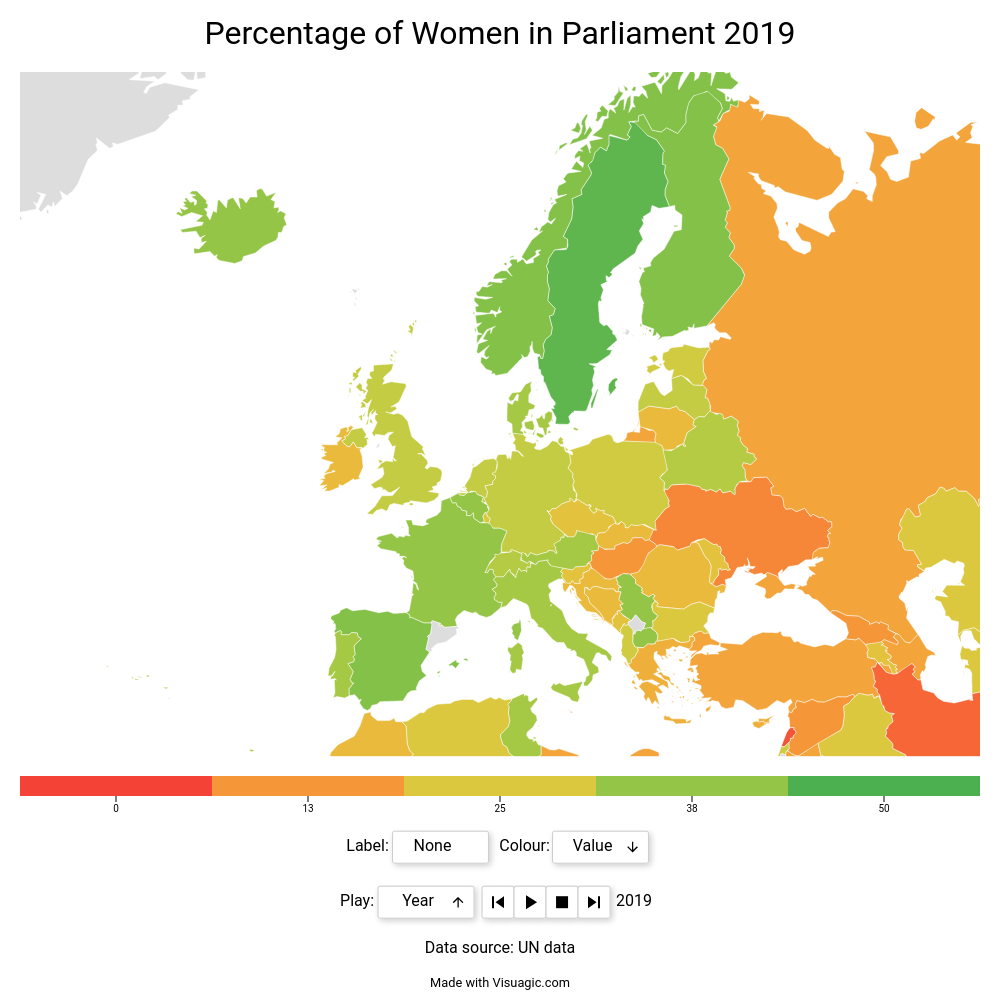
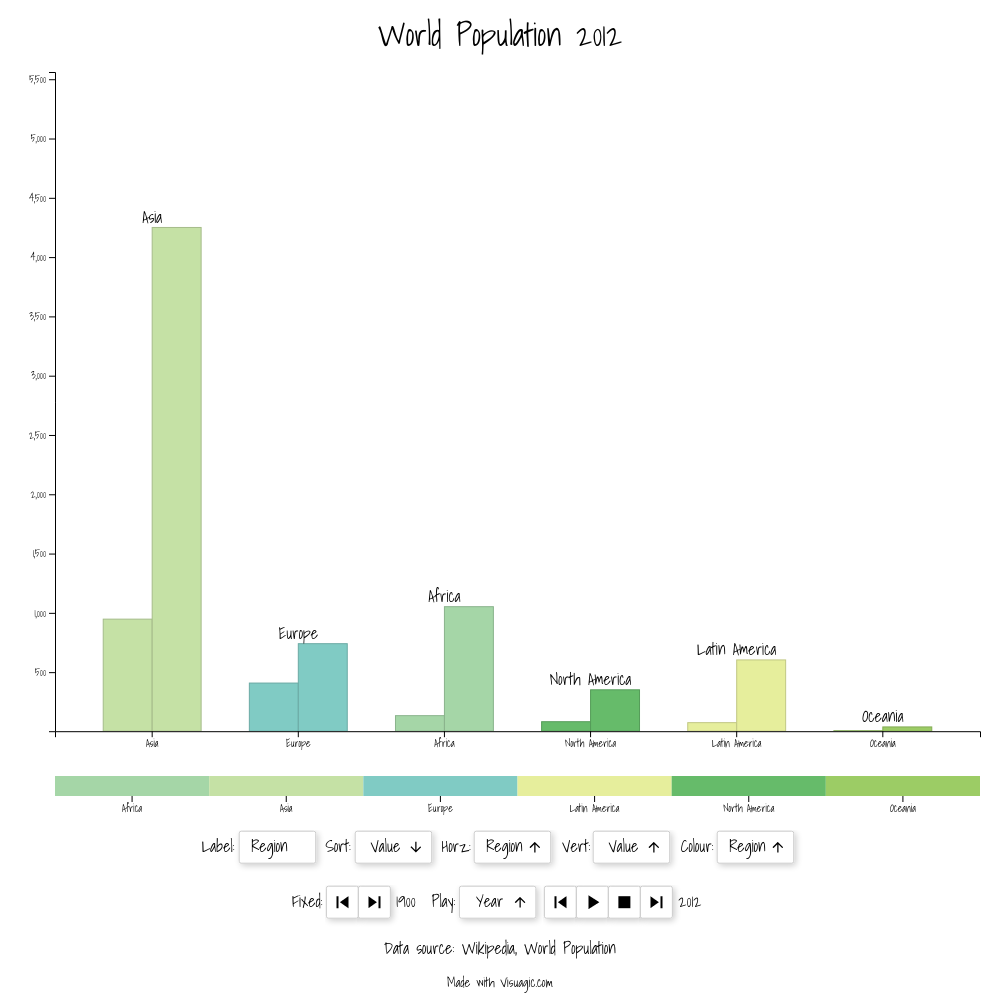
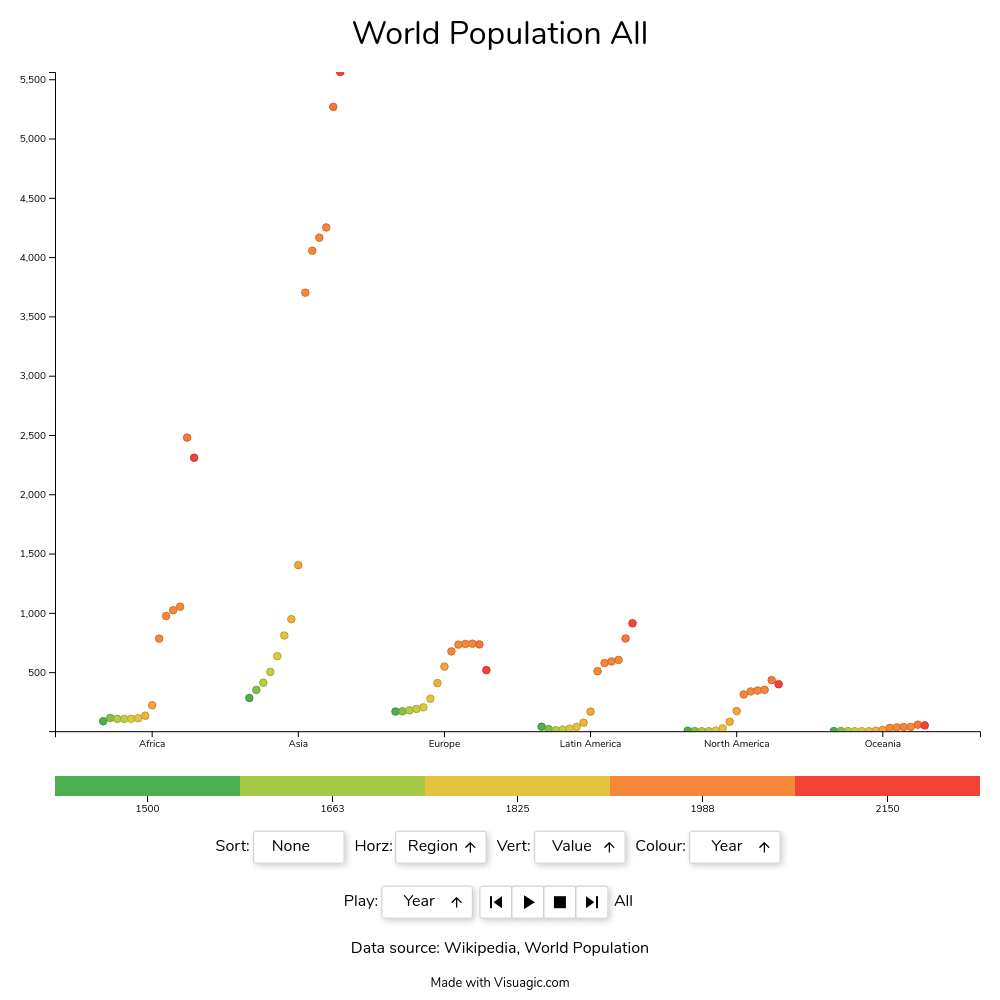
All our charts are interactive when saved as SVG so your users will be able to play with the data and look at it from different points of view. That can help them understand the message better and they will also spend more time on your website helping you to increase your engagement rate. There is also the option to save animated GIFs or still images.
EASY TO USE
No code or design skills required. Start by copy-pasting your data to run the data checker and parser. Then choose the chart type and visualisation options like fonts and colours to match your own style and branding. Finally adjust the initial visualisation on the chart itself and export it to the most suitable format. Simple and easy to user for you and for your users.